Gender structure in the management staff of the University of Warsaw
Gender structure of Rector and Vice-Rectors of the University of Warsaw
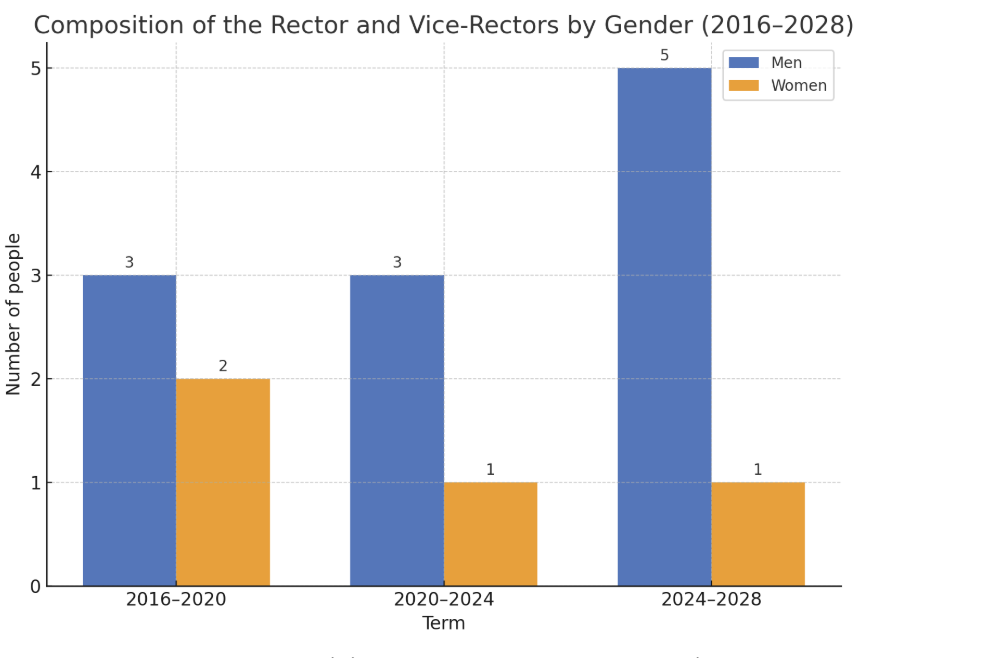
From 2016 to 2028, there is a clear trend of declining participation of women in the Rector and Vice-Rectors group.
In the 2016-2020 term, the group consisted of five members, two of whom were women and three of whom were men. The structure was relatively balanced, with women holding important positions, including Vice-Rector for Development and Vice-Rector for Student Affairs and Education Quality.
In the 2020-2024 term, the number of members decreased to four, one of whom was a woman. In this term, a woman took over the position of Vice-Rector for Student Affairs and Education Quality.
In the current term, 2024-2028, the group consists of six members, five of whom are men and one woman. A woman serves as Vice-Rector for Development, while all other positions (Rector, Vice-Rector for Cooperation and Employee Affairs, Research, Doctoral and Legal Affairs, Student Affairs and Education Quality) are held by men.
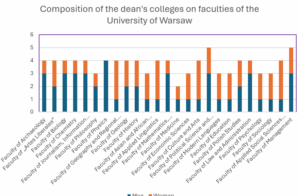
Gender structure of Dean's Colleges at the University of Warsaw Faculties
Deans
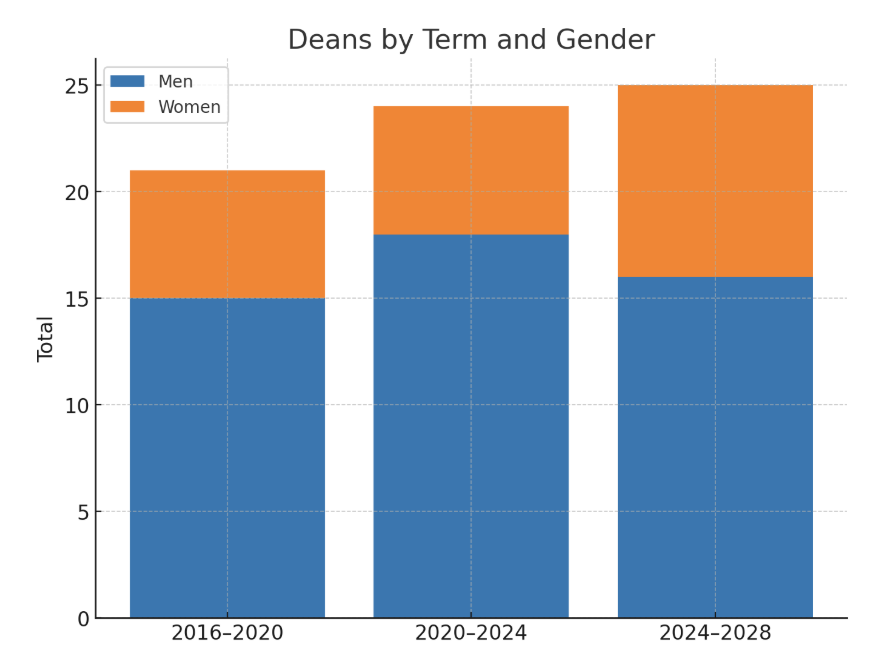
The composition of the group of Deans has changed noticeably over the years, both in terms of overall size and gender representation.
From 2016 to 2020, 21 people served as Deans, 15 of whom were men and 6 women.
In the next term, 2020–2024, the number of Deans increased to 24, with women still in the minority – 6 compared to 18 men.
The most recent term, 2024–2028, brought a further increase – to 25 deans, including 9 women.
Vice-Deans
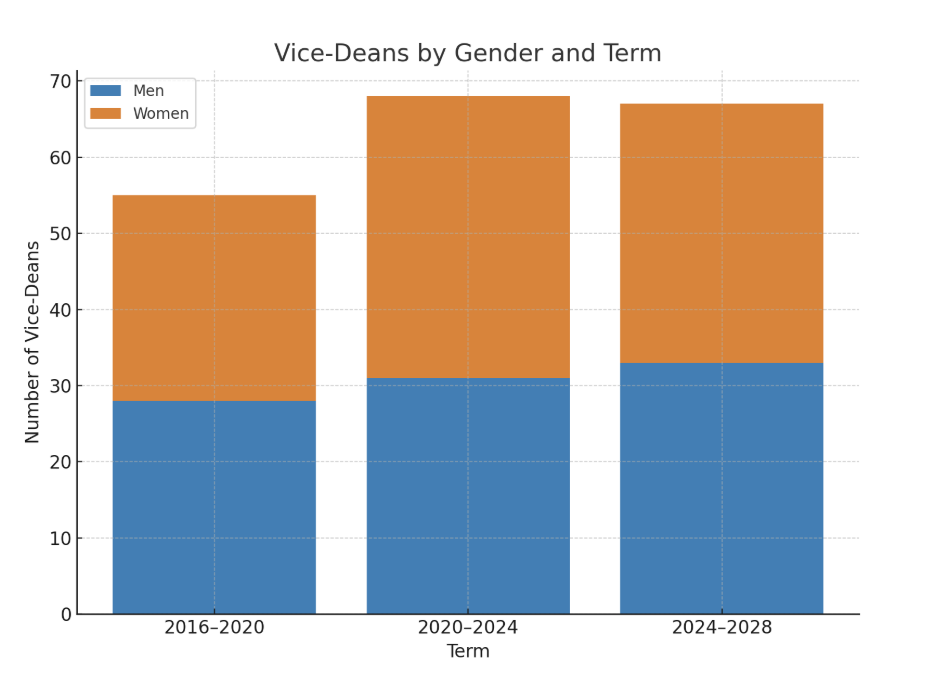
The number of Vice-Deans has also varied over successive terms, with notable shifts in gender balance.
The number of vice-deans in 2016–2020 was almost equally divided between women and men – 27 women and 28 men.
In 2020–2024, the number of vice-deans increased to 68, with women holding the majority of positions (37 compared to 31 men).
In the current term of office 2024–2028, the number of vice-deans is 67 and gender balance is maintained – 34 women and 33 men.
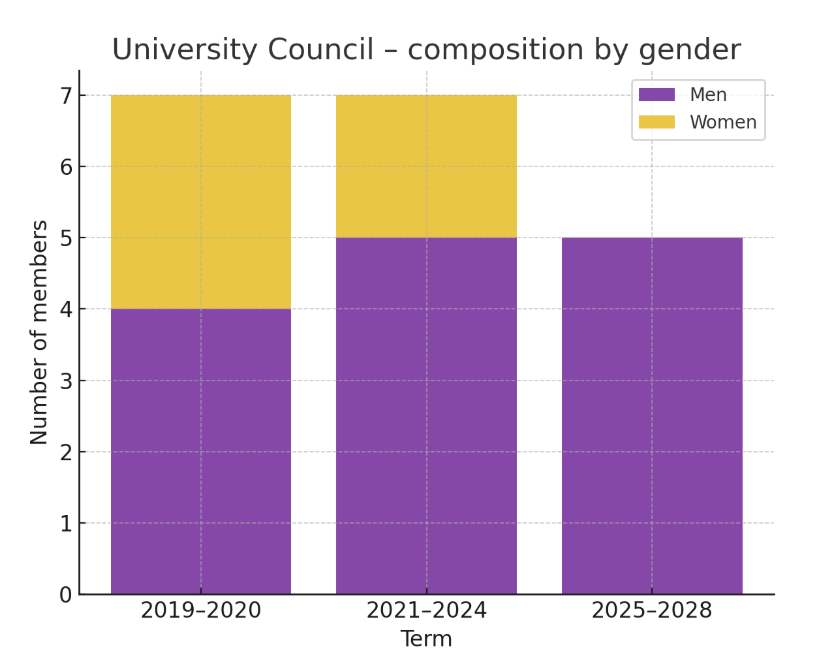
Gender structure of the University Council of the University of Warsaw
Across the three terms (2019–2028), the composition of the University Council shows a gradual decline in the number of women and an overall reduction in the size of the body (from 7 to 5), with the chair held by a man in every term:
-
2019–2020: The Council had 7 members — the chair was a man, and among the other members there were 3 women and 3 men.
-
2021–2024: Still 7 members — again with a male chair, and 2 women and 4 men as members.
-
2025–2028: The Council was reduced to 5 members, with the chair remaining male, and now 0 women and 4 men among the members. There is currently no female representation on the Council.
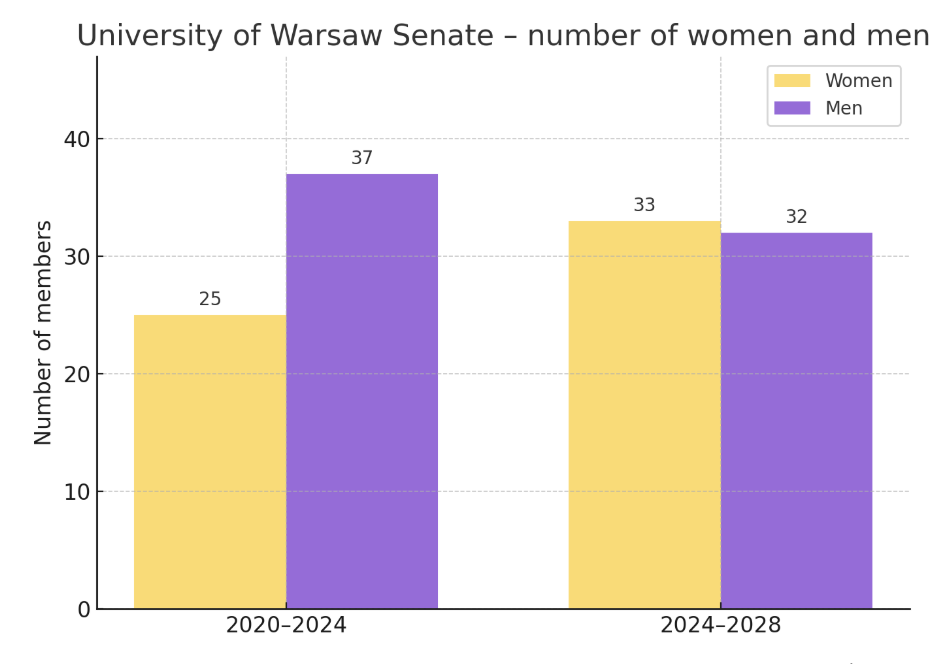
Gender structure of the University of Warsaw Senate
During the 2020–2024 term, the University of Warsaw Senate had 63 members, including 37 men and 25 women, with a male chairperson.
Men constituted nearly 60% of the membership, while women remained in the vast minority (approximately 40%).
In the next term, which run from 2024–2028, the situation changed significantly.
The number of Senate members increased to 66, and women achieved almost complete parity with men, and even gained a slight advantage – currently 33 women to 32 men, which equals to around 52% and 48%. The Senate Chairperson remains male.
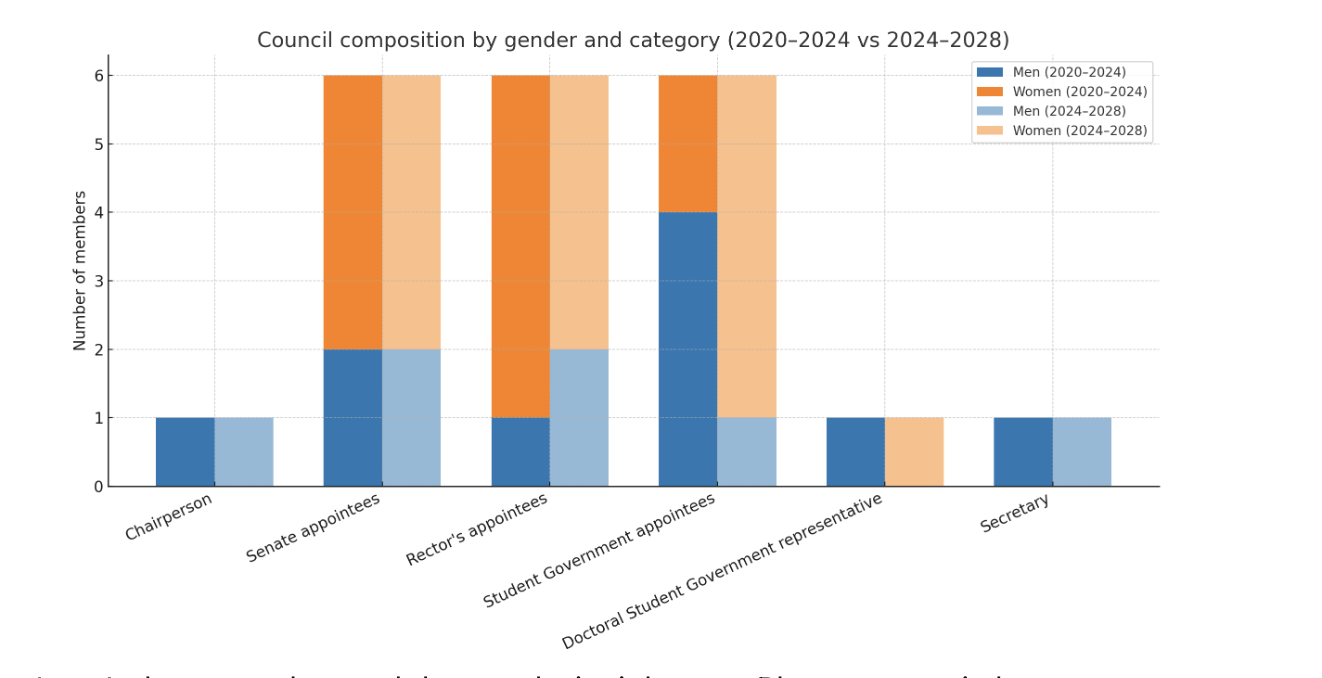
Gender structure of the University Education Council
During the 2020–2024 term, the University Education Council consisted of 21 members: 11 women and 10 men. The Chairperson was a man, as was the Secretary.
Detailed breakdown: 2 men and 4 women were appointed by the Senate; 1 man and 5 women by the Rector; 4 men and 2 women by the Student Government; and the Doctoral Student Government was represented by a man.
For the following term, 2024–2028, the overall number of members (21) was maintained, but the gender ratio was reversed – there are now 11 men and 10 women. Both the Chairperson and Secretary are still men.
Detailed breakdown: 2 men and 4 women were appointed by the Senate; 2 men and 4 women by the Rector; 5 women and 1 man by the Student Government; and the was represented by a woman.
Gender structure of the Coordination Council for Foreign Language Teaching
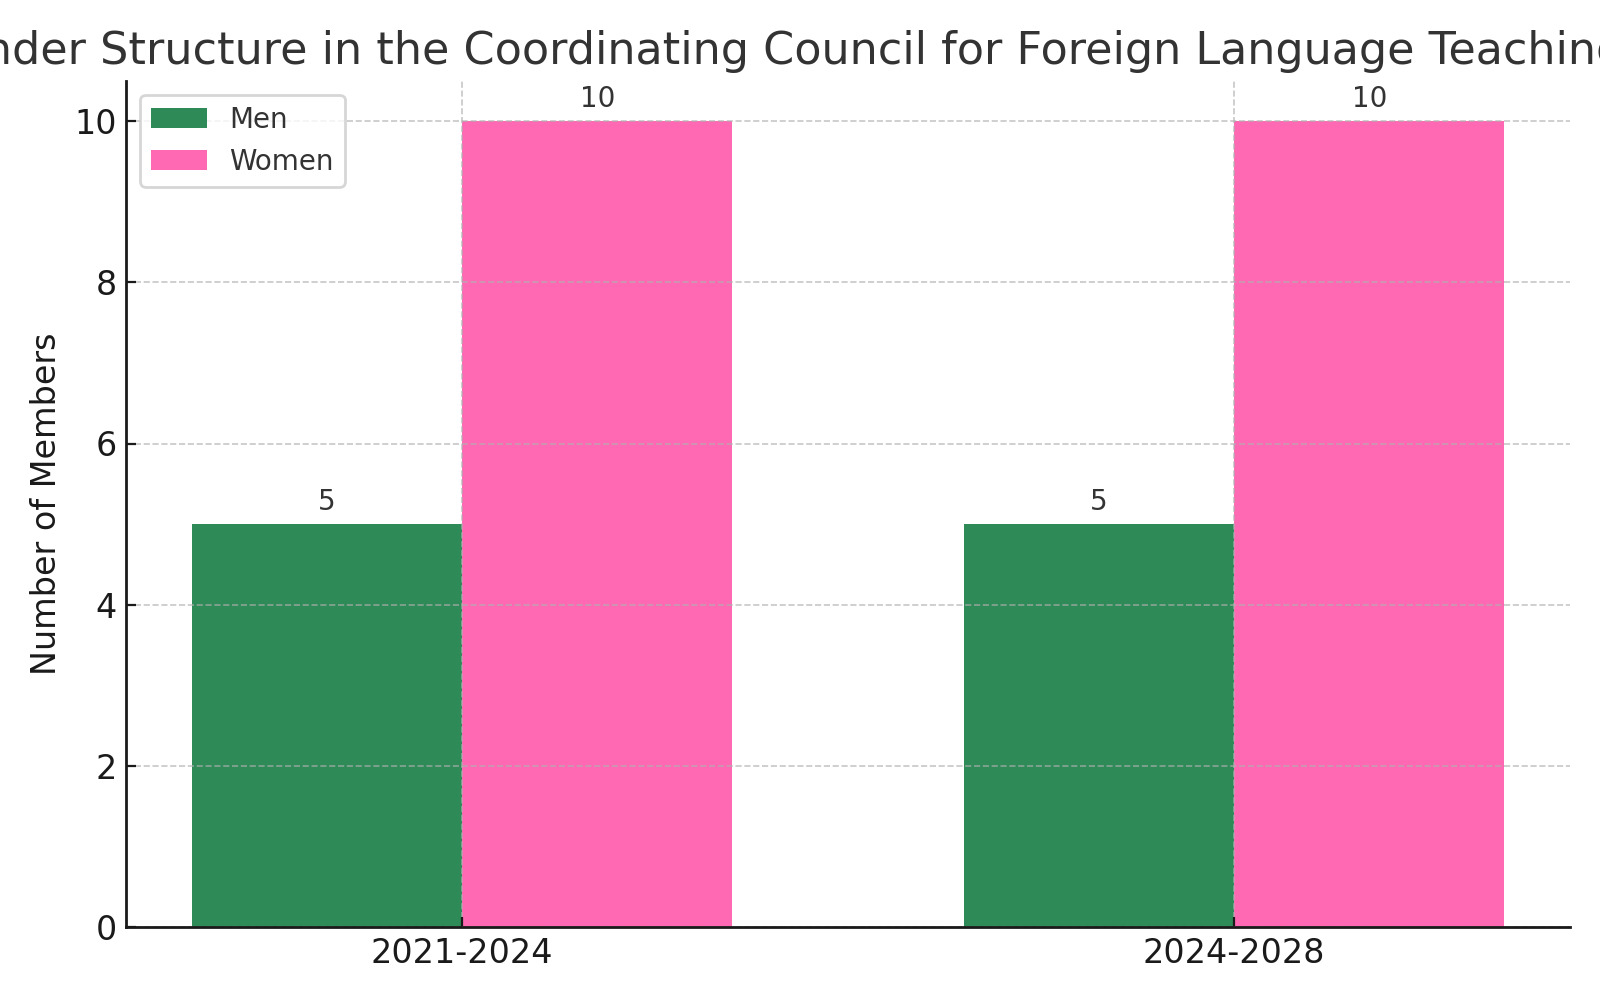
The gender structure of the University of Warsaw’s Coordinating Council for Foreign Language Teaching remains very similar.
In both the 2021–2024 and 2024–2028 terms, a man will serve as chair. The remaining members are four men and 10 women, resulting in a clear female preponderance on the body.
Ultimately, each term of office will consist of 15 members – five men and ten women. This means that women constitute the majority, comprising two-thirds of the entire membership during both terms.
Gender structure of the Scientific Council of the Disciplines
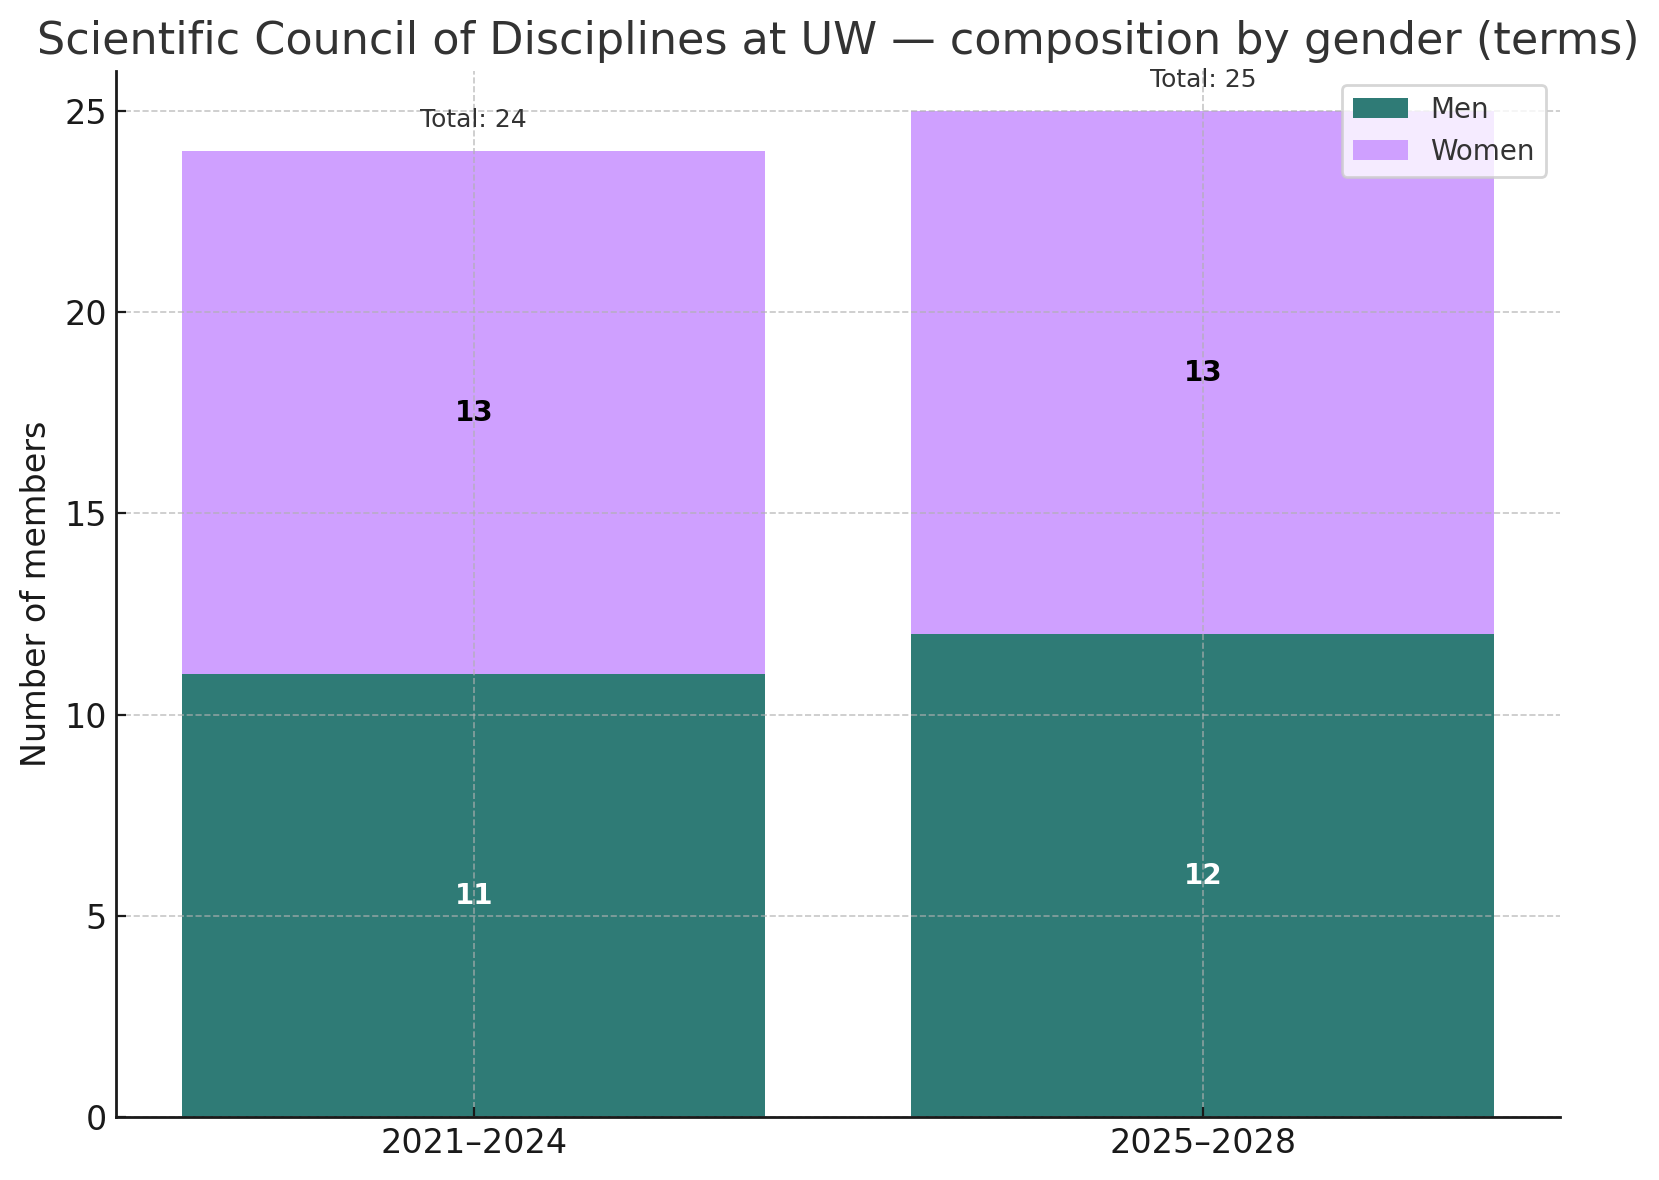
For the 2021–2024 term, a woman will chair the University of Warsaw’s Scientific Council for Scientific Fields.
The remaining members included 11 men and 12 women, which, combined with the chairperson, totaled 24 members, including 11 men and 13 women. Women therefore comprised just over half of the membership.
For the 2025–2028 term, the chairperson was again a woman. The Council included 12 men and 12 women, which, combined with the chairperson, totaled 25 members – 12 men and 13 women. The gender composition remains very similar, with a slight predominance of women.
Gender structure of Faculty Councils
A comparison of the last two terms (2020–2024 and 2024–2028) shows a significant increase in the number of Faculty Council members in many units and a continued predominance of men across the University. The proportion of women has increased slightly.
Total across all faculties:
- 2020–2024: approximately 930 men and 668 women (totaling approximately 1,598)
- 2024–2028: approximately 995 men and 763 women (totaling approximately 1,758)
This represents an increase of approximately 160 members (approximately 10%) and a slight shift in the structure towards a greater female representation.
Faculty with the largest male predominance
Faculty of Mathematics, Computer Science, and Mechanics:
- 2020–2024: 125 men, 29 women
- 2024–2028: 136 men, 32 women
Faculty of Physics:
- 2020–2024: 49 men and 9 women
- 2024–2028: 48 men and 11 women
Faculties with the largest female predominance
Faculty of Modern Languages and Literature:
- 2020 – 2024: 36 men and 85 women
- 2024 – 2028: 43 men and 109 women
Faculty of Applied Linguistics:
- 2020 – 2024: 11 men and 40 women
- 2024 – 2028: 32 men and 59 women
Departments with balanced gender representation
Faculty of Economic Sciences:
- 2020 – 2024: 60 men and 40 women
- 2024 – 2028: 50 men and 50 women
Faculty of Geography and Regional Studies:
- 2020 – 2024: 25 men and 30 women
- 2024 – 2028: 25 men and 30 women
Summary
The structure of Faculty Councils is still dominated by men, but the proportion of women is increasing year by year.
The general trend is a moderate increase in membership and greater gender diversity.
| Faculty | Men 2020–24 | Women 2020–24 | Total 2020–24 | Men 2024–28 | Women 2024–28 | Total 2024–28 |
|---|---|---|---|---|---|---|
| Applied Linguistics | 11 | 40 | 51 | 32 | 59 | 91 |
| Applied Social Sciences and Resocialization | 22 | 39 | 61 | 64 | 26 | 38 |
| Archaeology | 44 | 23 | 67 | 40 | 22 | 62 |
| Artes Liberales | 33 | 29 | 62 | 33 | 28 | 61 |
| Biology | 30 | 41 | 71 | 33 | 28 | 61 |
| Chemistry | 31 | 27 | 58 | 27 | 30 | 57 |
| Culture and Arts | 17 | 23 | 40 | 14 | 22 | 36 |
| Economics | 60 | 40 | 100 | 50 | 50 | 100 |
| Education | 13 | 31 | 44 | 10 | 33 | 43 |
| Geography and Regional Studies | 25 | 30 | 55 | 25 | 30 | 55 |
| Geology | 41 | 28 | 69 | 38 | 26 | 64 |
| History | 41 | 22 | 63 | 44 | 29 | 73 |
| Journalism, Information and Book Studies | 36 | 28 | 64 | 38 | 31 | 69 |
| Law and Administration | 135 | 70 | 205 | 147 | 82 | 229 |
| Management | 58 | 34 | 92 | 50 | 39 | 89 |
| Mathematics, Informatics and Mechanics | 125 | 29 | 154 | 136 | 32 | 168 |
| Modern Languages (Neophilology) | 36 | 85 | 121 | 43 | 109 | 152 |
| Oriental Studies | 23 | 49 | 72 | 28 | 40 | 68 |
| Physics | 49 | 9 | 58 | 48 | 11 | 59 |
| Polish Studies | 32 | 46 | 78 | 28 | 47 | 75 |
| Political Science and International Studies | 47 | 29 | 76 | 23 | 22 | 45 |
| Psychology | 12 | 25 | 37 | 13 | 24 | 37 |
| Sociology | 25 | 24 | 49 | 27 | 26 | 53 |
Gender structure of Disciplines Scientific Councils
Between the 2021–2024 and 2025–2028 terms of the Disciplines Scientific Councils, no major structural shifts in gender representation occurred, yet several clear trends can be observed.
Overall, the pattern remains stable: women continue to predominate in the humanities and social sciences, while men hold a majority in the exact, natural, and technical sciences.
The most female-dominated councils remain Linguistics (35 women vs. 10 men), Literary Studies (34 vs. 13), as well as Biological Sciences, Psychology, and Pedagogy. Conversely, male dominance is particularly visible in STEM fields such as Physical Sciences (36 men and 4 women), Mathematics, Informatics, and Astronomy.
The most balanced representation appears in areas such as Political and Administrative Sciences, Management and Quality Studies, Communication and Media Studies, and Studies on Culture and Religion, where the number of men and women is roughly equal. These councils can be viewed as examples of genuine gender parity.
Regarding leadership roles, men still more often serve as chairs in technical and exact disciplines, while women more frequently hold these positions in the humanities and social sciences. However, there is an increasing tendency to ensure balance by appointing deputies of the opposite gender, which indicates growing institutional awareness.
Comparing both terms reveals a generally stable gender structure with a slow but noticeable move toward greater diversity. In several councils, the number of women has slightly increased, suggesting a growing commitment to gender equality. At the same time, STEM disciplines still require targeted measures to strengthen women’s participation — both by encouraging candidacies and by ensuring equal access to leadership positions.
In summary, gender balance within the University of Warsaw’s Scientific Discipline Councils is gradually improving, though disparities between disciplines remain significant. The humanities and social sciences now serve as models of inclusivity, whereas the exact and technical sciences still call for proactive equality-oriented policies.
| Discipline | Chairs 2021 – 2024 | Women 2021 – 2024 | Men 2021 – 2024 | Chairs 2025 – 2028 | Women 2025 – 2028 | Men 2021 – 2024 |
| Archaeology | 2 men, 1 woman | 7 | 24 | 1 man, 1 woman | 10 | 21 |
| Astronomy | 2 men | 3 | 18 | 2 men | 3 | 14 |
| Economy and Finances | 1 man, 1 woman | 16 | 21 | 1 woman, 1 man | 14 | 22 |
| Philosophy | 2 women, 1 man | 10 | 19 | 1 woman, 1 man | 10 | 15 |
| Socio-Economic Geography and Spatial Geography | 2 women, 1 man | 13 | 6 | 1 man, 1 woman | 13 | 8 |
| History | 1 man, 1 woman | 12 | 25 | none | 12 | 22 |
| Linguistics | 3 women | 31 | 18 | 2 women, 1 man | 37 | 11 |
| Literary Studies | 1 man, 1 woman | 28 | 20 | 1 man, 1 woman | 35 | 14 |
| Informatics | 2020 – 2024 with Mathematics
2 men |
10 | 43 | 2 men | 4 | 25 |
| Mathematics | 2020 – 2024 with Informatics
2 men |
10 | 43 | 1 man, 1 woman | 8 | 21 |
| Biological Sciences | 2 women | 29 | 20 | 2 women | 29 | 20 |
| Chemical Sciences | 3 men | 18 | 30 | 3 men | 18 | 27 |
| Physical Sciences | 2 men | 6 | 34 | 2 men | 4 | 25 |
| Security Sciences | 2020 – 2024 with Political and Administrative Sciences
2 men |
19 | 28 | 1 woman, 1 man | 6 | 17 |
| Social Communication and Media Sciences | 2 men | 16 | 11 | 1 man, 1 woman | 18 | 10 |
| Cultural and Religious Sciences | 2 women | 27 | 12 | 2 women | 13 | 24 |
| Political and Administrative Sciences | 2020 – 2024 with Security Sciences
2 men |
19 | 28 | 1 man, 1 woman | 16 | 19 |
| Art Sciences | 1 man, 1 woman | 14 | 11 | 2 women | 24 | 13 |
| Management and Quality Sciences | 2 men | 10 | 11 | 2 men | 15 | 13 |
| Earth and Environmental Sciences | 2 men | 16 | 18 | 2 men | 10 | 23 |
| Legal Sciences | 2 men, 1 woman | 14 | 30 | 3 men, 1 woman | 10 | 35 |
| Sociological Sciences | 1 man, 1 woman | 25 | 11 | 2 men | 18 | 18 |
| Education | 2 men | 18 | 10 | 1 man, 1 woman | 13 | 8 |
| Psychology | 1 man, 2 women | 18 | 12 | 2 women, 1 man | 18 | 12 |
| International Relations | 1 man, 1 woman | 13 | 13 | 1 man, 1 woman | 13 | 12 |